
On the 25th March the Oil and Gas authority (OGA) in the UK released over 130 terabytes of data from the UK Continental Shelf (UKCS). The data, covering more than 12,500 wells, 3,000 pipelines and 5,000 seismic surveys, is now publicly available from the Oil & Gas National Data Repository (NDR).
Momentum for use of data science and artificial intelligence in oil and gas is building, and with releases such as the Equinor Volve data set in 2018, the industry is adding fuel to the fire with a hope to further accelerate the development of insight and technology. The data set is released on the OGA’s already established open data centre which also includes production data as well as several interactive maps and dashboards.
A brief exploration of the data
Accessing the NDR data is straightforward by registering as a user and logging in. The data is organised through interactive maps and tables. The maps provide a neat way of viewing infrastructure, seismic coverage and well-locations. With the data you can of course plot any visualisation yourself. Here we show an example of well locations on the UKCS plotted in a Jupyter Python notebook using GeoPandas and Matplotlib.
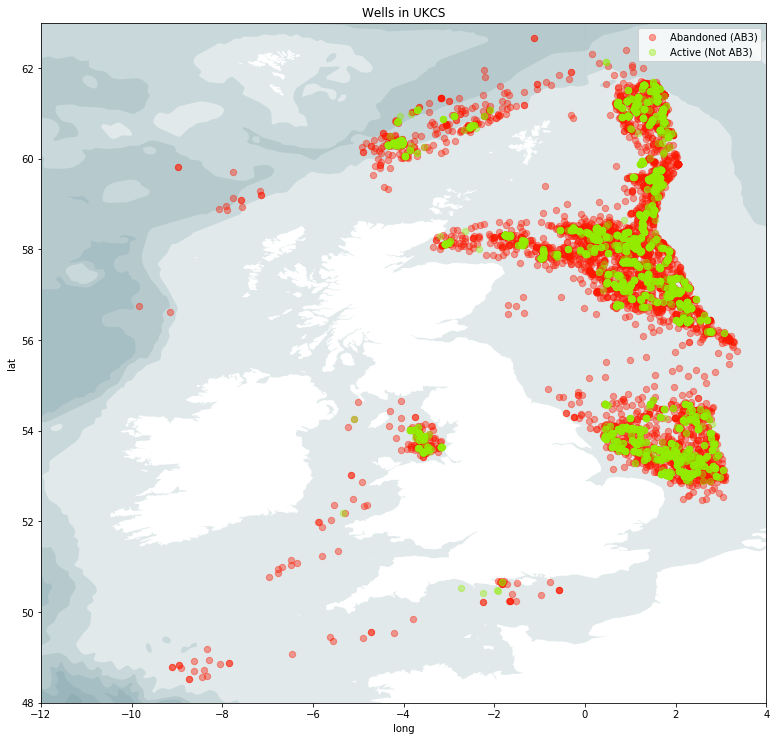
For those of you that are interested in the code, you can see the full notebook here.
The well data includes columns such as ‘spud date’ (when the drilling of the well started), ‘well type’ and ‘status’. Since 1964 a total of 12,157 well-bores have been drilled on the UKCS, only 5,173 of these are permanently abandoned (ie. permanently made safe and inaccessible). The remaining, almost 7,000, are still active or only temporarily abandoned.
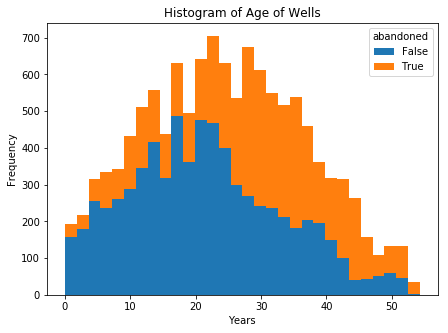
The peak activity on the UK continental shelf was in the mid to end 1990s when around 700 well-bores were drilled annually. Since then, the activity has dropped to just under 200 spudded wells in 2018.
At the end of 2017 the reported 2P reserves on the UKCS was 5.4 billion barrels of oil equivalent (boe), equivalent of 20 years production. The OGA is hoping that the release of this data can help halt the steep decline in well activity and drive investment to unlock what it claims to be an estimated further 20 million boe from the shelf.
Conclusion
The possibilities for use of this data set is wide ranging and will certainly be of great value to academia and industry alike. Collaboration and ability to share date freely will encourage publication. At Taank Technologies we are always glad to see more data being released publicly as this can only benefit data science and the industries it supports.
by Lars Pittman & Cammil Taank
